 |
| Slide 6: Beginning section on modern classification, cladistics, and how evolutionary relationships are reconstructed. |
| (Right-click to download pdf.) |
Classification, Ancestors, And Relationships
Q. And when you say "classification," what do you mean by that?
A. I mean precisely how we study the relationships of organisms. The basis of classification, since Darwin, has been the relationships that organisms have to each other.
And the concepts of how classification is done, how we, in other words, understand and construct the tree of life, the whole idea of who ancestors and what ancestors are and the relationships of organisms to each other are problems that works such as Pandas really do not reflect accurately the way that science understands these processes, procedures and methods.
Q. And have you prepared a demonstrative exhibit to help explain this?
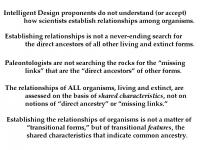
A. Yes. I'd like to do just a basic showing of what some of the principles are, if I could have the next slide to talk about that. In their texts, intelligent design proponents either do not understand or they don't accept how scientists establish relationships among organisms because most of this is left out of what their discussions are.
Despite a lot of popular impression, when we try to establish relationships among living and extinct organisms, it's not a never-ending search for direct ancestors. We don't go out in the fossil record, I don't go out looking for dinosaurs or whatever I'm doing in the summer in the field season looking for the ancestor of something else I know. I don't expect to find a direct ancestor of anything. The chances of that are really small. But I want to show you what we do try to look for.
 |
| Slide 7: Summary of what ID proponents do not understand about phylogeny reconstruction. |
| (Right-click to download pdf.) |
Paleontologists, in other words, are not searching the rocks for the missing links. Instead, when we, like all biologists, establish organisms, living and extinct, whether we work on bacteria or mosses or hoofed animals, it doesn't matter, we all do this according to the same methods in biology, and it doesn't matter whether we use molecules or fossils.
What we do is we look for shared characteristics. These are uniquely shared characteristics shared by certain organisms and not others. And by identifying these characteristics, we identify the pathway of evolution, that is, the order, the sequence, the genealogy of evolution. We want to find out who is most closely related to whom.
And the reasoning is that if an organism acquires a new trait and passes it on to its descendents, then those descendents will be more closely related to each other because they possess that new trait than anybody else in the world will be. And that's the principle that we use.
And this is a fairly simple concept to get across, and it's revolutionized the way that people do what we call systematics or to assemble the tree of life. But, in fact, this began in the 1960s and 1970s, and so for decades it's been the standard.
There are two concepts of ancestry that are important to point out here. One is lineal, and the other is called collateral. Lineal ancestors are the ones that are directly in your path, that is, your parents, your grandparents, your great grandparents, your great, great, great, and all the times you can say great, those are your direct ancestors.
But collateral ancestors are a little broader than that. They would include your aunts and uncles, your great aunt, your cousin twice removed on your mother's side, and that guy with the funny hat in the civil war picture on the wall in the dining room, whatever it happens to be. These are what we call collateral ancestors. They are individuals who are not directly in your ancestral line, but they still share so many of your features that they can tell us a lot about who you were -- who you are.
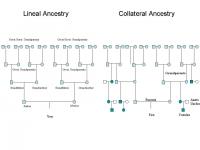 |
| Slide 8: Two kinds of ancestry, lineal and collateral. Collateral ancestor "is a legal term referring to a person not in the direct line of ascent, but is of an ancestral family" (Encyclopedia of Genealogy). Parents are lineal ancestors; siblings are collateral ancestors. Padian's point is that both are informative about ancestry - you share 1/2 of your genome with your mother, but also share 1/2 with your sister. Similarly, you share 1/4 of your genome with both your grandparent and your cousin. Creationists claim that paleontologists must find direct ancestors to document common ancestry, but this can be done equally rigorously with cladistic methods that identify "sister" and "cousin" groups on the basis of shared characters. |
| (Right-click to download pdf.) |
| Credits: Graphic by Liz Perotti, U.C. Berkeley. Reproduced with permission. |
If you know, for example, that your family came from Sweden in the 1800s, you can return to Sweden to the approximate place where they came. Maybe you can't find their bones in the church yard, but you can find the relics and the remains and the museum's evidence for many other aspects of their culture and their biology. You know what they ate, you know what they wore, you know the language they spoke. You may know from photographs and drawings what they looked like, what their features were. You may be able to recognize your ancestral features, as well. All these things are properties of collateral ancestors, not just lineal or direct ancestors.
So when we look to assemble the relationships of organisms, we don't have to find every direct ancestor. In fact, in the fossil record, it's really hard to say that somebody was anybody's direct ancestor, as I mentioned before with the fossil clams. We don't know what offspring any individual left. It's too hard for us to figure out. But we can still tell a great deal about it. And this is how we assemble the tree of life.
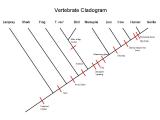
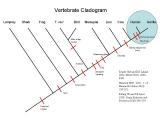
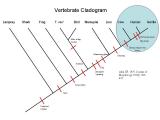
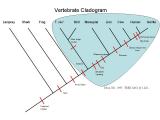
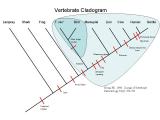
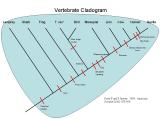
The next slide I have here is a preparation of a kind of diagram that we call a cladogram. And it's very similar to a phylogenetic tree, that is to say a tree of relationships. But the logic of this, I want to point out, is not something that's arbitrary. It's not simply assembled by art or by anything that's subjective. Rather, it is a diagram that reflects the grouping of organisms according to these new evolutionary features, these shared characteristics I mentioned before.
And if you can see the red marks along this -- the basic spine of the hat rack running from the lower left to the upper right -- these things always look like hat racks to me. I don't know what else you'd describe them as. But each one of those red bars represents a feature that was a new evolutionary feature that we reasoned was a new evolutionary feature because it suddenly is something that now all the animals above it share and the animals below it do not share.
So, for example, at the top here, the human and gorilla are united by a great many features, and we've only listed a few here because it would just really crowd things, and I think it's fairly obvious. Things that the human and gorilla share are a prehensile hand and a large brain. That is not the case for the cow, the lion, the marsupials, and the other animals on this slide.
We reason that on the basis of this and many other shared characteristics that these features were inherited from a common ancestor. It's the best natural explanation we can come up with. And as we go down this diagram even more, what we find is that at each juncture -- and if we can just stop it there for a second -- we find an increasing number of things that all these groups have.
And so if you look at the level put here on the chart that's indicated, there's a shared feature called an amnion, which is a property of one of the membranes of the egg around the embryo, that is shared by birds, marsupials, and placental mammals, but frogs and sharks and fishes don't have it. And so these hierarchically nested sets of features are the logical structure by which scientists establish the relationships of life.
|
| ||||||||
|
| ||||||||
|
| ||||||||
|
| ||||||||
|
|
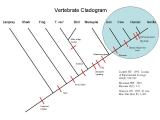
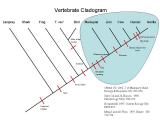
Q. I'm sorry, Professor Padian. Matt, if you could go back just a couple of slides. So you talked about how -- and I guess we read from left to right up the line is how you read this?
A. Well, all we can say is this is a depiction of how all these organisms are related. We don't look on this as a ladder of life. We don't look at it as fish give rise to frogs which give rise to birds. It's not like that.
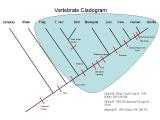
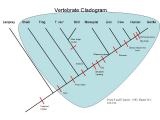
Q. But, for instance, where you have the stirrup-shaped ear bone --
A. Yes.
Q. -- and you have that line, so it would be the organisms above that that share that particular feature?
A. That's correct. That would be something that unites them to the exclusion of all the other critters on the slide. And that's the logic of cladograms, pure and simple.
I'd like to stress that we can use physical features like this, we can use them on fossils or on living animals, we can use them on molecules or we can use them on skeletal features or egg shell proteins or anything else that we want to do. Whatever works, we use. It's very practical.
Q. And is this a -- could you say it's a universal approach used by scientists?
A. Since the 1960s, it has become the dominant form of understanding relationships in the scientific community around the world.
I would go so far as to say that if you were going to apply to the National Science Foundation to ask for money to work on the classification of a group of organisms, whether it was dinosaurs or a group of bacteria or mosses or liverworts, you would have to show the review panel that you understood the principles that I'm discussing here and that you were going to use this kind of analysis in your work if you wanted to convince them that you knew what you were doing.
Q. And is this method somehow validated quantitatively or statistically?
A. Yes. And I'm glad you raised that point, because I've only put a couple of the features on this chart. But, in fact, there are hundreds that are represented in this analysis. And it's obviously too many for us to arrange by hand.
And so all the characters that we're talking about and all the animals that we're trying to analyze, we have ways of putting these into a data matrix and asking the computer essentially to sort this out for us to produce the simplest to the most, basically, complicated trees that you could possibly get. And we try to start with the simplest trees for further work, which is a principle in science called parsimony.
Q. And do intelligent design proponents use this type of cladogram?
A. I haven't seen them use any type of analysis like this in any of their works.
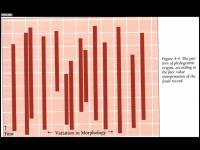 |
| Slide 19: Figure 4-4 from page 99 of Pandas (1993) alleges that the fossil record shows only sudden origin followed by stasis. |
| (Right-click to download pdf.) |
Creationism and the Fossil Record
Q. And if you could advance to the intelligent design slide. Is this a copy of a chart found in Of Pandas and People?
A. Yes. This is Figure 4 from Pandas, second edition.
Q. And can you tell us what this is?
A. Well, the caption says that it's the pattern of phylogenetic origins, according to the face value interpretation of the fossil record.
Q. And can you make heads or tails of this?
A. I have trouble. I'm not sure -- I guess I understand that time is the axis from top to bottom. That's perfectly fine, although there are no particular periods listed. I understand that they're looking at variation in morphology, and that's perfectly fine. But there are no names of organisms there, so I don't know exactly what they're talking about.
Also, the presence of these bars as straight bars without variation suggests quite strongly that organisms suddenly appear quite recognizable as what they are and do not vary in morphology all the way up through the geologic column until they peter out.
Q. So this chart would show that there's abrupt creation and then there's no change in those organisms throughout their lifetimes?
A. That would be the face-value interpretation that they say the fossil record shows. Now, I just want to point out that this implies that there is no substantial change in any fossil lineages because they have drawn only bars that go straight up with no change, no diversification, no anything.
Q. And if you represented a classification system in a grant application to the National Science Foundation like this, you don't believe you would get a grant?
A. Well, no, but, of course, this is not meant to represent any kind of research, it's meant to be a didactic device for teaching. I should also note that if we're talking about phylogeny in relationships, this wouldn't qualify because it doesn't draw any lines between those lines. It doesn't admit the possibility that any of those lines evolved from any of the others.