This is a report on an epidemiological inquiry. The morbid condition — so to speak — under study could be variously characterized as a deficit of knowledge or a disease of the intellect, one that involves accepting a theological answer to a historical question. Present means of identifying those afflicted do not provide a clear distinction between these two disabilities or mixtures of them. But of the two most useful bodies of data now available — the Gallup Poll and the General Social Survey (GSS) — one puts the emphasis on theology, the other on knowledge of science.
On 6 occasions, the first in 1982 and the others between 1991 and 2001, the Gallup Poll asked respondents to choose among three statements: "God created man pretty much in his present form at one time within the last 10 000 years (46%). Man has developed over millions of years from less advanced forms of life. God had no part in this process (10%). Man has developed over millions of years from less advanced forms of life, but God guided this process, including man's creation (38%)." ("Other" or "Don't know" responses accounted for the remaining 6%.) The numbers in parentheses are the averages of the 6 poll results. Averaging is justified because there is no indication of an upward or downward trend, and changes from one poll to the next are insignificant (see p 19).
The GSS question, asked in 1993, 1994, and 2000, "was conceived as part of a short science test" and presented as though it were a multiple choice question with 5 alternative answers in a school examination. Respondents could evaluate the statement, "Human beings developed from earlier species of animals," as Definitely true (14%), Probably true (29%), Probably not true (15%), Definitely not true (33%), Don't know (9%). Again, aggregating the data from the 3 surveys is justified by the absence of a trend.
There is no easy way to reconcile the percentage distributions from the two polls. An important project for the future is to ask the same people both questions in different sections of one survey, randomizing the order in which they are asked (Duncan and Schuman 1980; Duncan 1984). Such a design could help in deciding whether the two questions are isotopes, so to speak, of the same elemental reaction to evolutionary biology. What we can do in the meantime is compare the two sources with regard to how the responses vary by selected characteristics of the respondents or their other attitudes and beliefs.
How Many?
But first, it is important to note that there can be no unique answer to the "How many?" question until a great deal of further research convinces the science community that some one question is unequivocally preferable to any other as a single indicator of a complex, multidimensional phenomenon. We are here referring to the "Definitely not true" response in GSS as the "creationist" answer. Some might prefer to label it the "evolution denial" answer. But our labeling is only a matter of convenience and does not presuppose any theoretical justification. We make no pretense that this working definition, adopted for lack of a better alternative, resolves the essentially meaningless question of how a true "creationist" is to be recognized. It is, however, in accord with the dictum of the Institute for Creation Research that creation and evolution are mutually exclusive and jointly exhaustive of the basic explanations of the evidence (Marsden 1991: 154). ICR may be well advised. The several varieties of "old-earth creationism" (Scott 1999) have neither scriptural nor scientific support, although they might invoke the authority of Augustine. Preliminary analyses indicate that "Probably not true" is more closely akin to "Don't know" than to "Definitely not true." Hence we estimate that only one third of adult Americans are creationists in the strict sense of "evolution denial" whereas the Gallup question yields an estimate of 46% who implicitly rely solely on Genesis.
If this is confusing, consider the responses to the question asked in the Fox News/Opinion Dynamics Poll in August 1999: "Which do you think is more likely to actually be the explanation for the origin of human life on earth: the theory of evolution as outlined by Darwin and other scientists (15%), the biblical account of creation as told in the Bible (50%), or are both true? (26%)?" (Not sure responses accounted for the remaining 9%.) If forced to choose among these alternatives, many respondents find the task too difficult. In February 2001, the Gallup Poll asked, "Would you say that you believe more the theory of evolution (28%) or the theory of creationism (48%) to explain the origin of human beings, or are you unsure (14%)?" (The remaining 10% of responses were Don't know.) The high proportion who are unsure or do not know is consistent with other poll data showing that many people do not claim to know very much about the evolution/creationism debate. The evidence does not justify the assumption that respondents will always be logically consistent in their responses to different questions. (Why should that be a surprise?)
Who?
Turning to the "Who" question: Bishop (1998) provides a useful compilation of the Gallup data on factors related to creationism ("created man … within the last 10 000 years") which can be compared with similar data from GSS. In both data sets, women are somewhat more likely than men to be creationists, the elderly more so than the young, African-Americans more than whites, those who attend religious services often more than those who attend seldom or never, political conservatives more than liberals, and those agreeing with the pro-life position than those classified as pro-choice on abortion. The similarity of the patterns is not quite so unequivocal for rates of creationism in relation to political party identification and religious denominational preference. Both GSS and Gallup, however, do show relatively high rates for Baptists, much lower rates for Catholics, and the lowest rates for those with no religion.
The most interesting failure to replicate a relationship pertains to education. Table 1 shows the percentages of creationists in the two data sets:
| Table 1. Educational level of creationists | ||
| Education | Gallup | GSS |
| Less than high school | 64% | 36% |
| High school graduate | 57% | 37% |
| Some college | 44% | 36% |
| College graduate | 31% | 22% |
The GSS pattern will be seen below (Figure 1) to be a rather misleading average of quite different relationships observed within categories defined by religion variables.
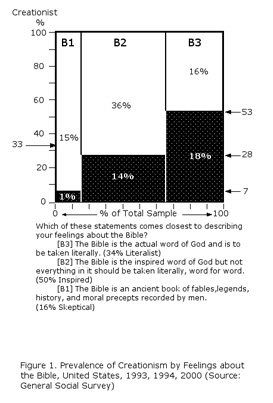
On the other hand, the association of creationism with beliefs about the Bible is somewhat the same in the two data sets, albeit stronger in the Gallup data. See Figure 1 for the wording of the Bible question, which is the standard wording in Gallup as well as GSS polls, and in the responses. The heights of the dark bars show the percentages of creationists among the biblical skeptics, the liberals who think the Bible is inspired but not to be taken literally, and the literalists: 7%, 28%, and 53% respectively. The corresponding rates of creationism in the Gallup data are 16%, 39%, and 77%. The width of the bars represents the relative popularity of the 3 Bible responses. About one-third of Americans are literalists, a half are rather more liberal, and one-sixth are outright skeptics. (These fractions agree approximately with the Gallup data as well.)
Apart from the differential rates of creationism that turn up in the cross-classification of creationism by response to the Bible question, it is important to analyze the makeup of the 33% of all people who are creationists (GSS definition). This information is conveyed by the areas of the dark bars, that is, their width multiplied by their height. We see that 18% are both literalists and creationists, 14% are creationists who take a more liberal view of the Bible, and 1% are creationists who are outright biblical skeptics. Thus, even though biblical literalism and creationism are clearly associated, only a little more than half of all creationists (18/33 = 55%) are literalists. The sum of the 6 percentages given inside the bars is 100%, the area of the entire square.
A puzzled reader, inspecting these results, remarked, "It is not clear how one can really be a biblical literalist and not be a creationist." The source of his perplexity is the commonsense resort to typological thinking rather than population thinking. In sociology, typology is deplored in discussions of the "stereotyping" of minority populations by ordinary people but approved when the same logic is used by sophisticated theorists and researchers. Emphasis on the importance of this distinction is especially strong in the writing of Ernst Mayr, who has frequently discoursed (1963, 2000, 2001) on the mischief typology has done in biology. One might as well wonder how a "real" fish can have legs, a reptile can have feathers, or a man can have nipples. When we encounter the word "really" used in this way, it is a reflection of Platonic essentialism in the speaker's thinking about the domain of human belief systems, although he would not make such a mistake when speaking of biological variation among organisms.
One way we — all of us — can easily get trapped in essentialism is by relying on summaries of poll results that show only one variable at a time instead of cross-classifications like the simple one in Figure 1 or the more complicated ones examined later herein. To be sure, about one-third of Americans are "literalists" and one-third are "creationists," understanding these terms as mere labels. But the two are not synonymous, and looking at the two figures separately gives no clue as to what proportion are both literalists and creationists, except that it must fall within the limits of 0 to 33%. The lesson for those who would improve science education is to avoid the oversimplification of thinking of the challenge as pertaining solely to creationist/literalists. There are many non-literalists out there who likewise need to be better informed about evolution; because they are not strict literalists, it may be easier to communicate with them. Our point is not new; compare Cole (1987–1988: 7): "Scientifically, theologically, and politically, people seem to be much more confused or heterogeneous than narrow-issue partisans claim." Partisans (a typological concept itself) are especially prone to the use of typologies.
Just as the proportion of creationists depends on what question is asked, the proportion that could reasonably be labeled literalist varies from one question to another. In a Gallup/Newsweek poll of December 1988, respondents were asked only to agree or disagree with the statement that "the Bible is the actual word of God and is to be taken literally, word for word"; no alternative responses were suggested. The literalist proportion was 54%, and the same result, 53%, was obtained in a CBS News/New York Times poll in July 1994, well above the 34% identified as literalists by the standard question. It must also be acknowledged that even when the same wording is used for the question, the proportion of literalists may differ among polling organizations, for reasons that are, at this point, far from clear (Duncan 2003). In paleostatistics, as in paleontology, we can only work from what has been preserved from the past for our inspection and study in the present. The evidence is always incomplete and is often equivocal.
Where?
Inasmuch as biblical literalism and creationism are usually and stereotypically linked to the so-called Bible Belt, we now take a first look at the "Where" question. There is indeed a strong geographic correlation between the percent taking a literalist view of the Bible in response to the question on feelings about the Bible in GSS and the percent who respond "definitely false" to the proposition that humans developed from earlier species of animals. Figure 2 brings out the differential prevalence of biblical literalism in regions of the United States and contrasts the proportion of literalists with the proportion of creationists in the regions. In both displays, the Bible Belt is the focus. But there are some anomalies. In the Bible Belt narrowly defined, there are quite a few more biblical literalists than creationists, whereas in the two western regions creationists considerably outnumber literalists. This is another telling bit of evidence warning against presupposing too tight a relationship between literalism and creationism. One could suggest that the questions eliciting the creationist and literalist responses do not have quite the same meaning in California and Tennessee. But the methodological issues raised by such a suggestion are formidable (Duncan 1986). We return to the regional differences after examining some additional religious variables related to the prevalence of creationism.
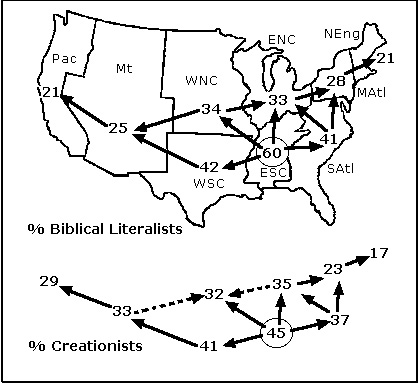 |
Arrow points from higher to lower percentage; dotted arrow shows pattern inversion between upper and lower plots. Region abbreviations stand for Pacific, Mountain, West North Central, East North Central, Middle Atlantic, New England, South Atlantic, East South Central, West South Central |
| Figure 2. Bad News from the Bible Belt: Geographical Correlation of Biblical Literalism and Creationism, 1993, 1994, 2000 (Source: General Social Survey) | |
Beyond Typologies
In Figure 3, we summarize the information in the 5-way cross-classification of creationism by belief in God (G), denominational preference (R), and frequency of attendance at religious services (A), as well as feelings about the Bible (B). With a sample of only 2426 respondents, we must resort to drastic simplifications. For example, the question on belief in God as presented in the interviews had 6 response categories, one for the modal category — the category with the most cases — which we term "firm believer" (G2), and five for the several responses indicating belief but with doubts, wavering belief, belief in a higher power but not a personal God, profession of the impossibility of knowing anything about God, and denial that there is a God. (For full details, see the GSS codebook: Davis and others 2000). Fundamentalist and Moderate Protestants (R3) comprise a large number of separately identified denominations. Please note that "Fundamentalist" here is not a label vouchsafed or approved by the respondent but a grouping of denominations developed by Smith (1990) for GSS on the basis of historical origins and statements of doctrine by the various denominations. In particular, a person can prefer one of the denominations classified as Fundamentalist without personally affirming all or any of the "five tenets" historically presented and advocated since early in the past century by some as "The Fundamentals". Marsden (1991) is a basic source on this matter as well as the complex evolution of fundamentalism. Especially interesting to NCSE readers is Marsden's testimony in the historic case of McLean v Arkansas (now available on-line at http://www.antievolution.org/projects/mclean/new_site/pf_trans/mva_tt_p…) in which, among other things, he emphasizes the heterogeneity of fundamentalists; some have five, others different numbers of precepts. Here is another place where typological thinking can do great mischief. Not all Fundamentalists are fundamentalists and vice versa. Some fish do have legs.
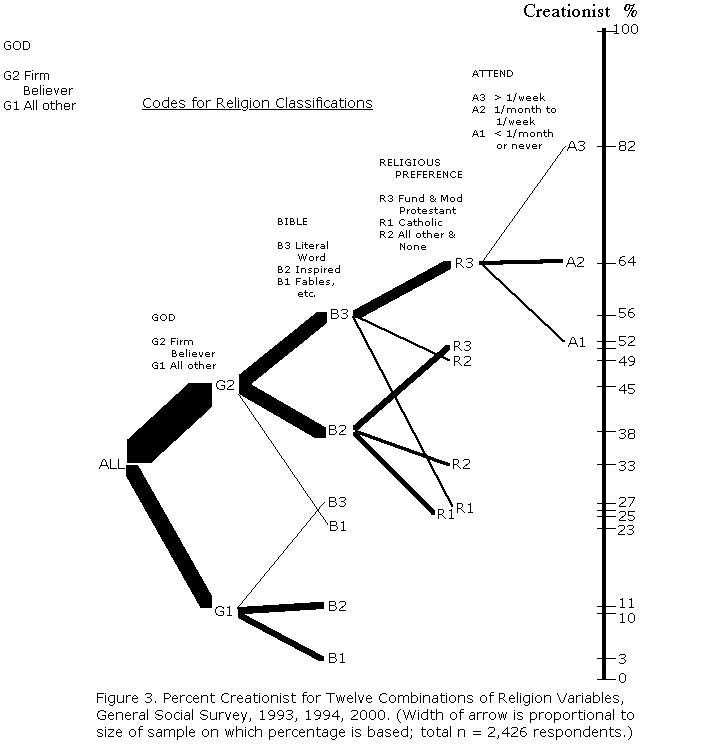
The tree diagram (Figure 3) is intended to convey information about both the heterogeneity of the American population with respect to religious commitments and the variation in prevalence of creationism among the subpopulations that can be identified with the variables at our disposal. There are 54 logically possible subpopulations in the 4-way cross-classification of G ¥ B ¥ R ¥ A with the categories defined in Figure 3. Many of them are thinly populated, to be sure, but all of them would be encountered in significant numbers in the American population. It would be interesting to study the variation in creation prevalence across these 54 subpopulations. But because of the small sample size, the estimates of percentage creationist for most of them would be statistically meaningless. Hence we resort to a grouping of the 54 into 12 combinations that are produced as one variable after another is introduced to create cross-classifications. Even with this drastic compression of the data, several of these 12 occur so infrequently that the prevalence estimates, shown on the right-hand scale of Figure 3, are not highly reliable. What we have here can be likened to a small-scale highway map of a large state as contrasted with a detailed road map of a single county. We must ignore interesting interactions that might be reliably estimated with much larger samples. Sample size is a pervasive problem in analyzing data from surveys of religious behavior, which are not supported by funding from such major government programs as is space exploration.
Let us indicate explicitly how to read the figure. Taking "ALL" the population as 100%, the relative widths of the two arrows leading to G2 and G1 indicate that about two-thirds of the sample are Firm Believers (G2), one third being "All Other" (ignoring the heterogeneity of this residual category). When G2 respondents are classified according to feelings about the Bible, we find that about 31% of them are Firm Believers who take the Bible literally (G2 B3) and nearly the same percentage regard it as an inspired book but not necessarily to be understood literally (G2 B2), while only 4% are Firm Believers but biblical skeptics (G2 B1). Reading horizontally to the scale on the right, we find the contrasting percentages of these groups who are creationists to be 56, 38, and 23%, respectively. To identify a subpopulation with a higher prevalence of creationists, we need the further subdivision labeled by G2 B3 R3, who comprise 21% of the sample with a prevalence of 64% creationists. And to isolate a subpopulation with more than a two-thirds majority of creationists, we must isolate the G2 B3 R3 A3 sector that accounts for only 98 respondents (4% of the sample), where there is anything near unanimity — 82% prevalence of creationists — as to the falsity of human evolution. The estimate of 82% prevalence is of course subject to a large margin of sampling error. But the contrasts among the three subcategories of G2 B3 R3 defined by A3, A2, and A1 levels of attendance are unmistakably significant. Leaving other interesting comparisons to the reader, we simply note that the variation in prevalence of creationism among the 12 subpopulations dramatically illustrates the extreme heterogeneity of the religious sectors of the American public with respect to acceptance or rejection of evolution. Any one of the four variables by itself can give only an inkling of that heterogeneity.
The most startling finding of our study, one not hitherto anticipated by earlier research as far as we know, turns up when we look at the religion variables and education simultaneously. In Figure 4, we compare groups of adults of all ages with differing levels of educational attainment. Hence, the data for older people generally pertain to educational experiences undergone at more or less distant times in the past, not to the current output of the educational system. The interaction of education and religion is highlighted when we reduce the 12 combinations of religion indicators in Figure 3 to just 5, by grouping those with similar prevalence rates of creationism. In the sector defined by firm belief in God in combination with biblical literalism and medium to high frequency of attendance at religious services (top curve in Figure 4), persons with more advanced schooling actually are more likely to be creationists than those with lesser amounts of education. Pennock (2000: 37) observes that proponents of creationism have been successful in seeing to it that "many students of [fundamentalist and evangelical] religious backgrounds now enter university primed to resist evolution." And nowadays there is no shortage of institutions similar to Bob Jones University whose programs in biology are specifically intended to convert simple ignorance of evolution into terminologically sophisticated evolution denial. The positive relationship of creationism to education among the very religious may become even stronger in the future.
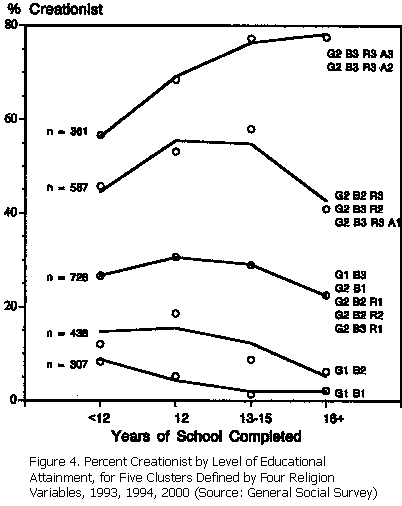
To find the expected negative relationship of education to creationism which we see in the Gallup data, we have to look at the one-eighth of the population who are not firm believers (including explicit non-believers) and who are skeptics in regard to the Bible (bottom curve). The three intermediate curves track the distortion of that relationship as more serious religious commitments of one kind or another are specified in identifying the groupings. Here and throughout the inquiry we must be wary of assuming well-defined causal chains. People who come to doubt the dogma of creationism upon learning about evolution in school may revise their religious beliefs and commitments accordingly. Or, to the contrary, those who maintain their creationist stance all the way through graduate school may use their education only as a means of defining more clearly what it is that they are against. Others — those experiencing early indoctrination in creationism and growing up in the religious environment in which this is likely to occur — may be less likely to pursue advanced education. And we cannot distinguish between the people who completed college without ever having a decent course in biology from those who followed the preacher's advice to college students heard in Oklahoma in the 1930s: answer the biology quizzes in such a way as to satisfy the teacher while maintaining faith in the Bible as the only infallible authority.
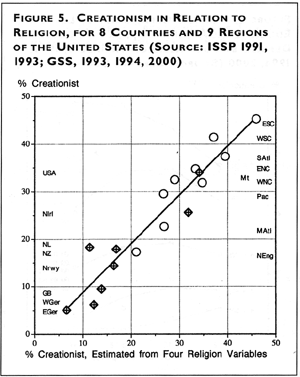
Such uncertainties notwithstanding, it seems reasonable to suggest that religion defeats education, or has done so in the past, in the United States in a way or to an extent that is not observed in other countries comparable to the United States in regard to political maturation, economic development, and history of religious commitments. We have data from the International Social Survey Program for seven such countries. We calculated the percentage of creationists that would be observed in each of these historically Protestant countries, given their actual distributions of responses to the four religion variables and assuming the rates of creationism associated with combinations of those variables to be the same as those in the United States. In Figure 5, we treat the nine geographic regions as if they were so many additional countries.
If in all cases the percentage of creationists observed in each country or region were to be identical to the percentage expected on the basis of the kind and degree of commitment to religion in these areas, all the data points would lie on the diagonal of the chart. That is very nearly true. The plotted line that best fits the data is very close to that diagonal. Hence the striking result that most of the variation in the proportion of creationists among regions and countries is explained by the varying grades of religiosity measured by our indicators.
This conclusion is not as robust as we would like. The preferred strategy would be to look at tree diagrams for each geographic entity in the fashion of Figure 3. But the sample sizes would not support such a detailed analysis. Moreover, for the foreign countries, the data on feelings about the Bible are available only for 1991 and cannot be cross-classified with creationism, which is available only for 1993. Hence we are limited to the indirect approach just described. But we can be sure that the summary results in Figure 5 average out some interesting interactions that occur in certain countries but not in others. Pending a more adequate database, it is not productive to speculate about reasons for the larger deviations from the diagonal — positive for the Netherlands, negative for Northern Ireland, for example. What is most striking in Figure 5 is the very slight overlap of the US regions and the foreign countries. It is as though only the northeastern states are in the same civilized universe as the countries while Northern Ireland might well be regarded as an overseas extension of the American Bible Belt.
Conclusions
The Bible Belt is bigger than readers may have thought, not only geographically but also metaphorically, in the sense that biblicism in the United States clearly affects the reaction to evolution on the part of persons who are not in any strict sense biblical literalists. Scholars in the humanities, accustomed to look at broad historical patterns rather than details of statistical analyses, may nonetheless come up with diagnoses that have the ring of truth. Thus, a remark of Sloan (2000), discoursing on the "Bible belting" of this country, is relevant in pondering the results laid out here, even if it goes beyond what can be rigorously demonstrated: "Ecclesiastical institutions … continue to implant powerful psychological deterrents to independent thought." To the institutions most likely to have influenced our older respondents may be added the burgeoning creationist web sites and the Discovery Institute — well known to readers of RNCSE — not to mention the legion of TV preachers and other sources of disinformation in various media and the clear willingness of some prominent legislators to destroy whatever science gets in the way of their program to make these United States into a Christian theocracy.